

A simple but powerful way to measure customer loyalty, satisfaction and long-term advocacy.
Often referred to as “The Ultimate Question”, Net Promoter Score (NPS) has become one of the most widely used customer experience metrics across modern businesses. Simple, effective and easy to benchmark over time, NPS helps organisations understand how likely customers are to recommend their brand, product or service.
What is the Net Promoter Score?
The NPS question is always the same:
“How likely are you to recommend [company / brand / product] to a friend or relative?”
Respondents answer on a scale from 0 to 10, with 10 being “extremely likely”.
Customers are then grouped into three categories:
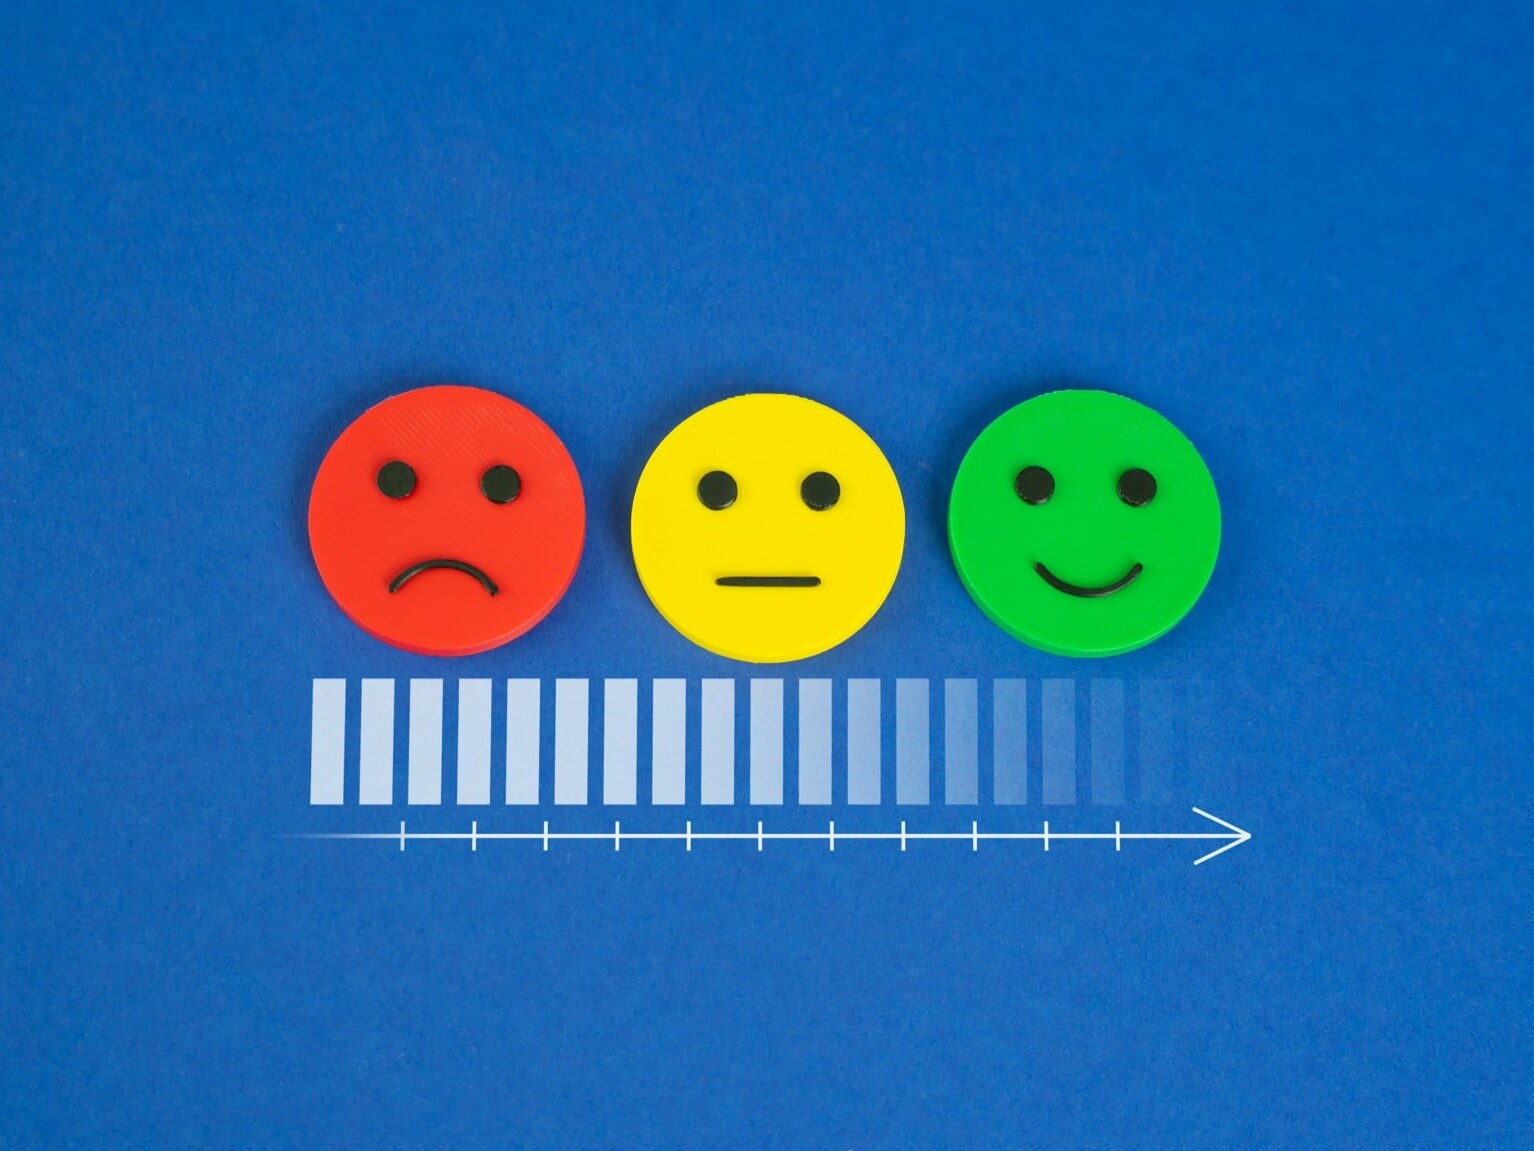
- 😟 0–6 = Detractors
- 😐 7–8 = Passives
- 😀 9–10 = Promoters
This simple framework allows businesses to quickly understand customer loyalty and sentiment.

How is NPS Calculated?
To calculate your Net Promoter Score:
Percentage of Promoters – Percentage of Detractors = NPS
Passive responses are excluded from the calculation.
Your final score is shown as a number between -100 and +100.
Typical businesses may score between -10 and +10, while strong-performing brands often achieve +50 or higher. However, NPS should always be viewed in the context of your industry and customer expectations.
Most importantly, NPS works best as a tracking tool, helping businesses monitor whether customer perception is improving over time.
Why Use Net Promoter Score?
- 📈 Track customer loyalty over time
- 🧠 Understand customer sentiment quickly
- 🎯 Identify opportunities for improvement
- 💬 Gather actionable feedback alongside scoring
- 🔄 Benchmark performance across teams, regions or locations
NPS works best when supported by follow-up questions that help explain why customers gave their score. This additional insight allows businesses to take meaningful action, whether that means addressing concerns from detractors or turning passives into promoters.


Is NPS Enough on Its Own?
While NPS is widely used, it is not without criticism.
Some businesses feel the scoring model is too simple, particularly as scores of 7–8 are classified as “Passive” and do not contribute positively to the final result.
Others point out that score distribution matters. For example:
- A business with 60% Promoters and 20% Detractors achieves the same NPS as
- A business with 40% Promoters and 0% Detractors
This is why context, supporting questions, and trend analysis are essential when using NPS effectively.
A Powerful Tool When Used Correctly
Used within the right framework, and backed by thoughtful analysis, Net Promoter Score can be an extremely effective way to monitor customer experience and drive positive change.
At Tern, we help businesses build tailored NPS programmes that go beyond the score itself, turning customer feedback into meaningful insight and measurable improvement.